FortiGate ログ、レポート設定例
[更新: 2024年5月29日]
1. 概要
弊社による検証データの一部を公開した記事掲載となります。参考までにご利用ください。
注釈
お客様個別の要件定義、設計、開発・設定補助に関するサポートは、FortiGateVMのライセンスサービスに含まれません。上記、ご注意ください。
1.1 検証条件
本掲載による事前検証は、さくらのクラウド環境により実施された内容です。
FortiGateは、GUIとCLIのサポートとなります。掲載はCLI、GUIを適宜使い分け掲載いたします。
本掲載により利用された検証環境のFortiOSは、両系ともに7.0.12です。
コマンドの一部は、<>記載により抽象化、強調記載を行います。お客様が入力を行う際は<>を削除、入力します。
本内容は仮想アプライアンス内部に保管される情報です。vrrpを利用する際は其々にデータが保管されます。
2. Log設定
FortiGateのログは、FortiOSに設定に従いアクセス、着信・送信するトラフィックログを内部・外部に作成、保管します。
本掲載は、運用に重要なログ(ローカルログ)に関する一部設定に関する説明となります。参考までにご利用ください。
Document Library Viewing event logs
https://docs.fortinet.com/document/fortigate/7.0.12/administration-guide/536166/viewing-event-logs
注釈
仮想サーバーのリソースに関する情報は、作成・保管はされません。リソースを計測する際は別に監視設定を行い保管します。
重要
NIC(Port)への着信などを確認する際は、パケットキャプチャ機能も併用します。
2.1 ローカルログ(メモリ)
FortiOS 標準の設定は、メモリ内に作成・保管される メモリログ が有効です、メモリログの機能によりサーバーメモリの一部にログが保管されます。
メモリ内部への記録という特性上、上書きによる保存・再起動により消失などが発生します。
重要
問題、問い合わせ用途に重要な情報のため、メモリログの使用は一時的な利用、検証利用までにご利用ください。長期間の保管はFortiGate Cloud(有償)、後述のログディスク、SNMP、syslogへの転送などを検討ください。
2.1.1 メモリログのGUI設定
GUI、CLIによりログの操作、設定は異なります。GUIは簡単な設定のみとなり詳細はCLIによる操作が必要です。
GUIによる操作は、下記のメニュー順に操作、ログ設定画面を表示します。
ログ&レポート >>> ログ設定
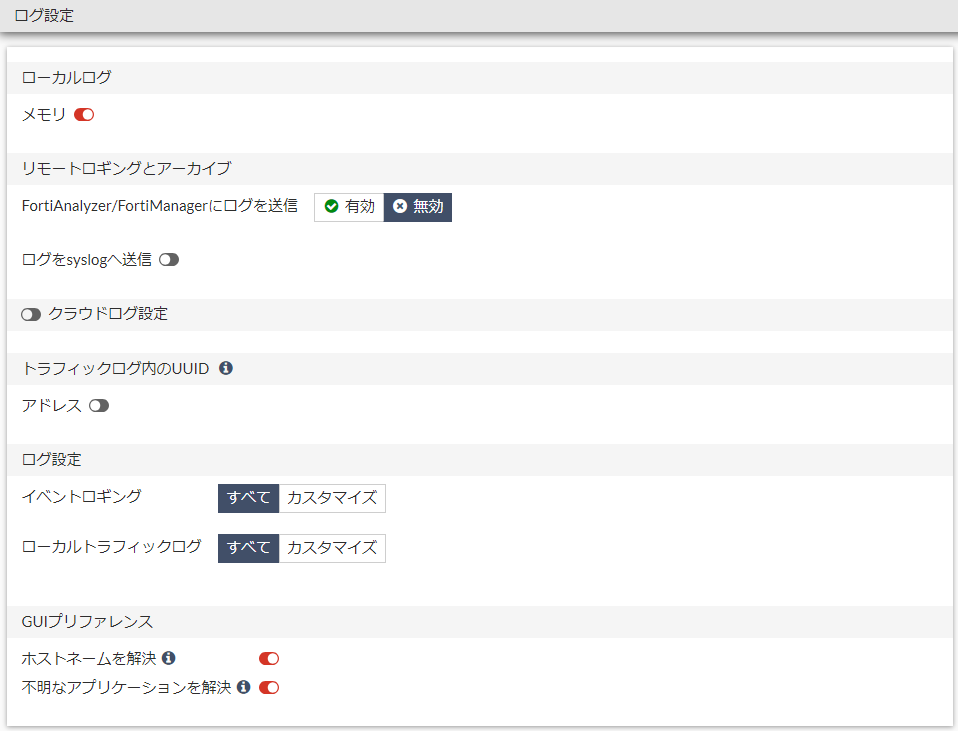
GUI ログ設定画面
下記はGUIによる設定可能な設定概要となります。
項目 |
説明 |
|---|---|
ローカルログ |
メモリのトグルをON/OFFにより有効、無効が可能です。 |
リモートロギングとアーカイブ |
FortiAnalyzer/FortiManager/syslogなど他管理アプライアンスやsyslogサーバーへ送信します。 |
クラウドログ設定 |
FortiGate Cloudへのログ送信設定とログの送信量を確認します。 |
トラフィックログ内のUUID |
トラフィックログのアドレスに対しUUIDのログ定義について、トグルをON/OFFにより有効、無効が可能です。 |
ログ設定 |
ログの作成・送信に関して各項目毎にまたはすべてにより設定が可能です。 |
GUIリファレンス |
IPアドレスからホスト名への変換、不明なアプリケーションに対してInternet Service Databaseを参照し解決を試みる機能について、トグルをON/OFFにより有効、無効が可能です。 |
Fortinet Document Library Log settings and targets
注釈
ログ設定画面は、事前にFortiGate Cloudの接続を登録済みの為、表示されます。利用されない際はクラウドログ設定のボタンを操作し無効にします。
2.1.2 メモリログのCLI設定(一部)
CLIにより使用する容量の閾値設定、条件などを変更することが可能です。参考までに一部のconfigの初期状態を掲載します。
メモリログの有効/無効に関する設定
GUIと同様に有効/無効のみが設定済みです。
Fortisacloud_master # config log memory setting
Fortisacloud_master (setting) # show full-configuration
config log memory setting
    set status enable
end
Fortinet Document Library FortiGate/FortiOS 7.0.12 CLI Reference config log memory setting
https://docs.fortinet.com/document/fortigate/7.0.12/cli-reference/412620/config-log-memory-setting
メモリログの閾値に関する設定
logの保管最大容量閾値、警告に関する閾値などを設定します。閾値の設定はCLIのみの操作です。
Fortisacloud_master # config log memory global-setting

Fortisacloud_master (global-setting) # show full
config log memory global-setting
    set max-size 52144414
    set full-first-warning-threshold 75
    set full-second-warning-threshold 90
    set full-final-warning-threshold 95
end
Fortinet Document Library FortiGate/FortiOS 7.0.12 CLI Reference config log memory setting
メモリログのフィルター設定に関する設定
フィルターは、作成される各ログの有効/無効、作成する条件の設定が可能です。
Fortisacloud_master # config log memory filter

Fortisacloud_master (filter) # show full
config log memory filter
    set severity information
    set forward-traffic enable
    set local-traffic disable
    set multicast-traffic enable
    set sniffer-traffic enable
    set ztna-traffic enable
    set anomaly enable
    set voip enable
    set gtp enable
end
Fortinet Document Library FortiGate/FortiOS 7.0.12 CLI Reference config log memory setting
https://docs.fortinet.com/document/fortigate/6.2.2/cli-reference/375620/log-memory-filter
注釈
severity設定により生成されるログが異なります、確認に必要なログが記録されない可能性があります。
2.2 ローカルログ(ディスク)
FortiOSは、ディスク内に作成・保管される ディスクログ へ変更することが可能です。
ディスクログは、FortiGateを利用する仮想サーバーに2台目のディスクを追加することで自動認識、取得を開始します。
2.2.1 ディスクログの追加
ディスクの追加は、さくらのクラウドコントロールパネル、またはAPIによる操作などで追加します。
下記はさくらのクラウド コントロールパネルによりSSD ディスクを追加後の状態です。
さくらのクラウド ディスク画面(Fortisacloud_backup)
作成した空のディスクをFortiGateVMを利用するサーバーへ接続します(#2)。
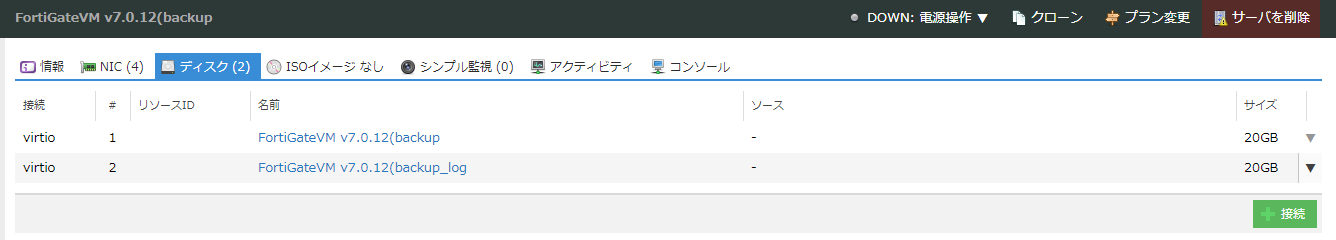
ディスク番号 |
説明 |
|---|---|
#1 |
FortiOS インストールディスク |
#2 |
FortiOS log保管ディスク |
注釈
ディスク追加操作は、サーバーの停止後に操作が可能です。追加ディスクを接続する際は、サーバーを停止後、ディスクの追加操作を実施ください。
重要
利用する機能、アクセスの状況によりログ生成される量が異なります。また、ディスクのIOPSはクラウドの仕様上、ディスク容量により異なります。追加するディスクは要件に応じて選定ください。
2.2.2 GUIのディスクログ
サーバー起動後、追加ディスクがFortiOSにより自動認識されます。
ログ設定画面
再度ログ設定画面を確認すると表示される情報がディスクログに変更されます。
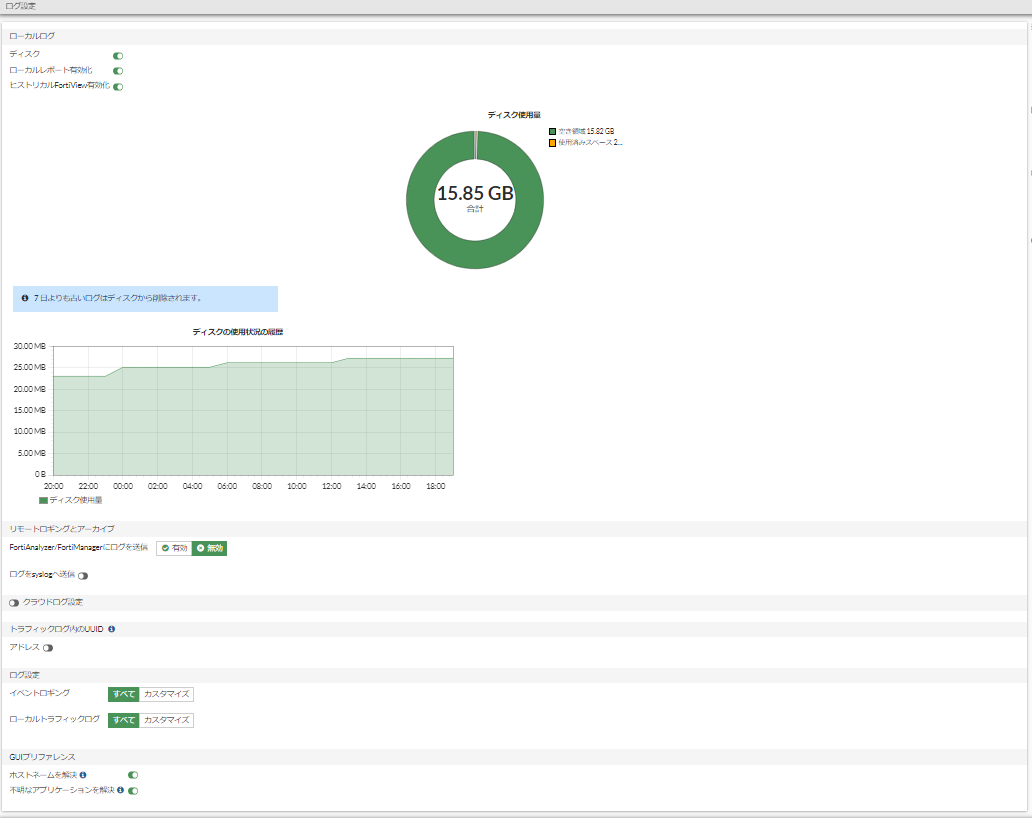
注釈
仕様上、75%の容量が利用可能です。参考画面は20GBのディスクが追加された際の保管容量の表示です。
2.2.3 CLIのディスクログの確認
下記のコマンドにより利用中のdisk容量に関する情報を確認することが可能です。
参考コマンド
Fortisacloud_backup # diagnose sys logdisk usage
Total HD usage: 183MB(175MiB)/21136MB(20157MiB)
Total HD logging space: 15851MB(15117MiB)
HD logging space usage for vdom "root": 0MB(0MiB)/15851MB(15117MiB)


Fortisacloud_backup # execute disk list

Disk Virtual-Disk    ref:  16  20.0GiB    type: IDE [Virtio Disk] dev: /dev/vdb
partition ref:  17  19.7GiB,  19.5GiB free  mounted: Y  label: LOGUSEDXE04D38C6 dev: /dev/vdb1 start: 2048
注釈
ディスク追加後は、GUIによるメモリログの有効/無効設定ができません。
2.2.4 ディスクログの設定
自動認識されたディスクログの設定は、下記の初期状態になります。
メモリログと比較すると保存期間、保存方法に関する設定など追加設定が可能です。各項目を運用・保管要件に合わせて変更します。
ディスクログに関する共通設定
Fortisacloud_backup # config log disk setting

Fortisacloud_backup (setting) # show full
config log disk setting
    set status enable
    set ips-archive enable
    set max-policy-packet-capture-size 100
    set log-quota 0
    set dlp-archive-quota 0
    set report-quota 0
    set maximum-log-age 7
    set upload disable
    set full-first-warning-threshold 75
    set full-second-warning-threshold 90
    set full-final-warning-threshold 95
    set max-log-file-size 20
    set roll-schedule daily
    set roll-time 00:00
    set diskfull overwrite
end

*status                            Enable/disable local disk logging.
ips-archive                       Enable/disable IPS packet archiving to the local disk.
max-log-file-size                 Maximum log file size before rolling (1 - 100 Mbytes).
max-policy-packet-capture-size    Maximum size of policy sniffer in MB (0 means unlimited).
roll-schedule                     Frequency to check log file for rolling.
roll-time                         Time of day to roll the log file (hh:mm).
diskfull                          Action to take when disk is full. The system can overwrite the oldest log messages or stop logging when the disk is full (default = overwrite).
log-quota                         Disk log quota (MB).
dlp-archive-quota                 DLP archive quota (MB).
report-quota                      Report db quota (MB).
maximum-log-age                   Delete log files older than (days).
upload                            Enable/disable uploading log files when they are rolled.
full-first-warning-threshold      Log full first warning threshold as a percent (1 - 98, default = 75).
full-second-warning-threshold     Log full second warning threshold as a percent (2 - 99, default = 90).
full-final-warning-threshold      Log full final warning threshold as a percent (3 - 100, default = 95).
Fortinet Document Library FortiGate/FortiOS 7.0.12 Administration Guide Log settings and targets
注釈
参考のCLI設定は一部となります。詳細はメーカーのマニュアルを参照ください。
3. レポート
FortiGateは、FortiOSのログを参照、レポートを作成することが可能です。
本解説は、FortiGateVMにより作成されるローカルレポートを解説します。
3.1 ローカルレポートの表示
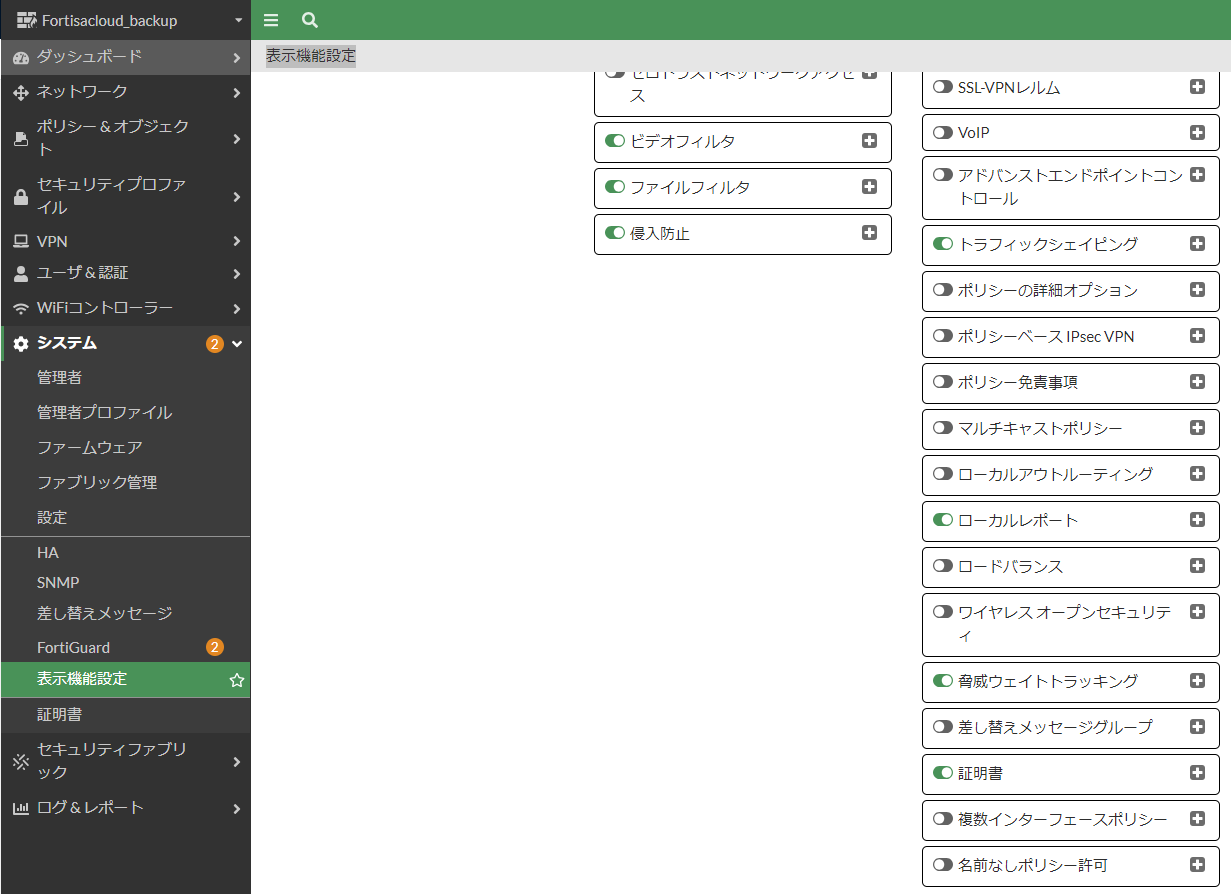
ローカルレポートの利用は、事前に一部設定を変更する必要があります。下記のメニュー順に操作、表示機能設定 ローカルレポートを有効にします。
表示機能設定
システム >>> 表示機能設定 >>> ローカルレポート
ローカルレポートの表示を変更後、下記のメニュー順に操作、ローカルレポートの設定を表示します。
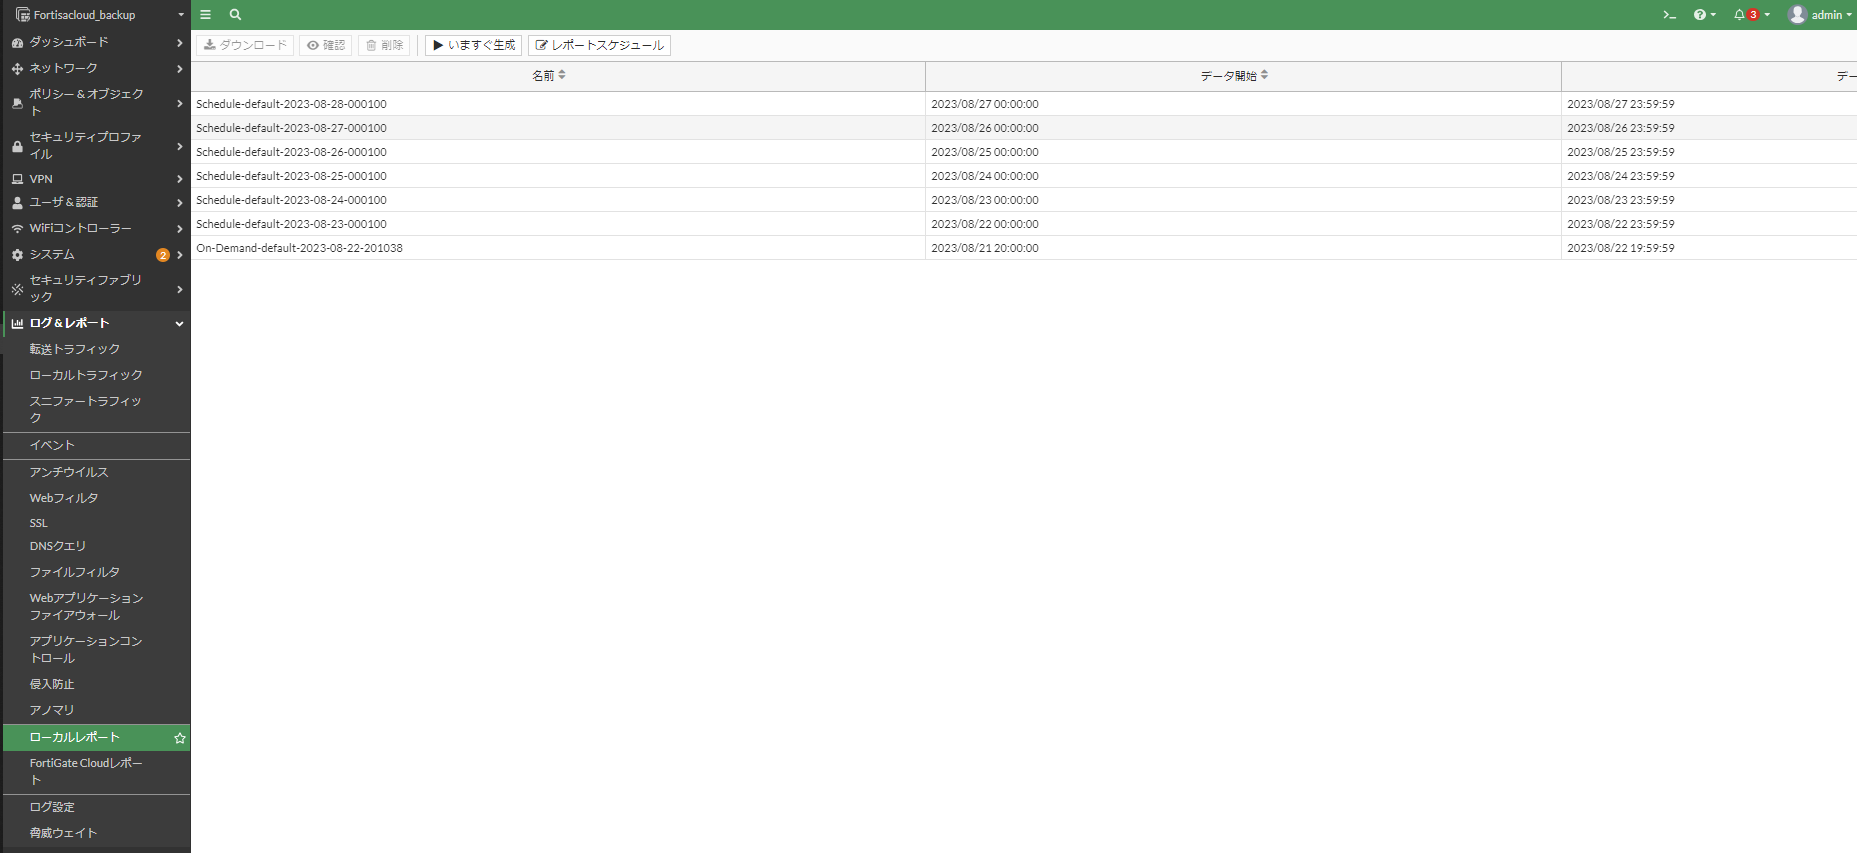
ローカルレポート 管理画面
ログ&レポート >>> ローカルレポート
下記はレポートスケジュールの設定を1日1回生成とした際の画面です。
3.2 レポート目次
ローカルレポート設定画面を操作することで、レポートの生成・送信・DLが可能です。
下記は生成されるレポートの目次です。参考までに生成される内容を確認ください。
ローカルレポート Table of Contents
Table of Contents

Bandwidth and Applications
    Bandwidth
    Number of Sessions
    Traffic Statistics
    Top Applications by Bandwidth
    Top Application Categories by Bandwidth
    Top Users by Bandwidth
    Number of Active Users
    Top Destinations by Bandwidth
Web Usage
    Top Allowed Websites
    Top Websites by Bandwidth
    Top Blocked Websites
    Top Users by Blocked Requests
    Top Users by Requests
    Top Users by Bandwidth
    Top Video Streaming Web Sites by Bandwidth
Emails
    Top Senders by Number of Emails
    Top Senders by Combined Email Size
    Top Recipients by Number of Emails
    Top Recipients by Combined Email Size
Threats
    Malware Detected
    Malware Victims
    Malware Sources
    Malware History
    Botnet Detected
    Botnet Victims
    Botnet C&C
    Botnet History
    Intrusions Detected
    Intrusion Victims
    Intrusion Sources
    Intrusions Blocked
    Intrusions By Severity
    Intrusion History
    FortiGate Daily Security Report - Host Name: Fortisacloud_backup
VPN Usage
    Site-to-Site IPSec Tunnels by Bandwidth
    Client-to-Site IPSec Tunnels by Bandwidth
    SSL-VPN Tunnel Users by Bandwidth
    SSL-VPN Web Mode Users by Bandwidth
Admin Login and System Events
Admin Login Summary
    List of Failed Logins
    System Events
注釈
ローカルレポートのメール送信は、事前にメールサーバーの設定が必要です。生成のみの際は不要です。
3.3 定期的な生成と送信
FortiGateVMにより作成されるローカルレポートは、レポートスケジュールにより定期的な生成とメール送信が可能です。
ローカルレポート設定画面のレポートスケジュールにより設定が可能です。
レポートスケジュール設定画面
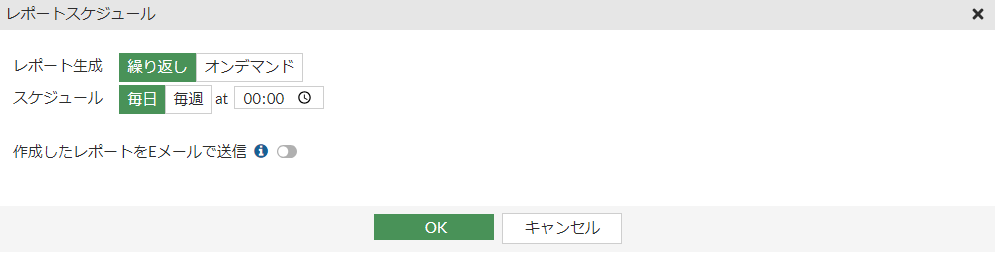
注釈
レポートのメール送信は、事前にメール送信を行うサーバー指定を行う必要があります。
4. その他のログ、設定情報の採取
FortiOSは、ログ&レポートに表示されるログ以外に問い合わせや設定の抽出、投入を行う機能が別に存在します。
4.1 デバッグログ
デバッグログは、トラブル発生時に生成、メーカー、テクニカルサポートへ提出する向けの機器情報を抽出するログ機能です。
execute get show diagnose 関連のコマンドが一括で実行されるなどが主な内容です。
イベントログ、トラフィックログなどは含まれないため、トラブル発生時の問い合わせには別途、該当のログが必要となります。
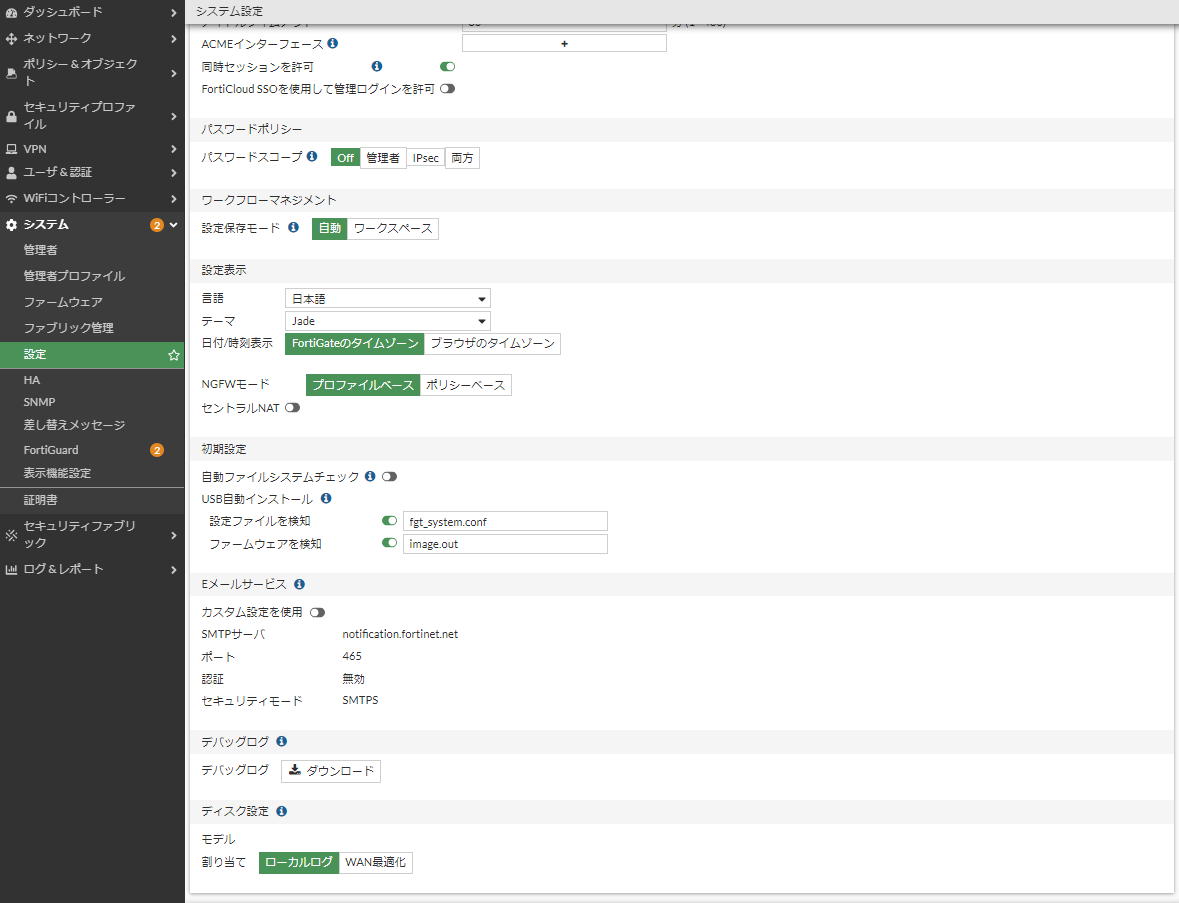
下記のメニュー順に操作、デバッグログをダウンロードします。
システム設定画面
システム >>> 設定 >>> システム設定 >>> デバッグログ
4.2 設定の取得、再投入
アプライアンスの設定ファイルは、GUI/CLI操作により取得と再投入が可能です。
設定ファイルはテキストベースにより参照可能なため、取得した内容を直接編集後、再投入により適用も可能です。
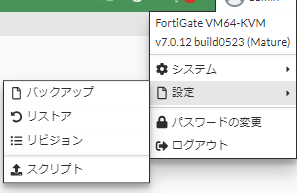
画面右上のユーザ メニューを操作、設定ファイルの取得、再投入します。
設定(コンフィグ)操作メニュー
ログイン名 >>> 設定
4.3 GUIのログ表示
GUIのログ表示は、Log Message Referenceに於いて定義された情報、IDなどを基に表示されます。
CLIからGUI表示を逆引きのうえ表示項目を追跡する際は、こちらを事前に確認ください。
詳細は、下記のドキュメントを参照ください。
FortiDocument Library FortiOS Log Message Reference
https://docs.fortinet.com/document/fortigate/7.4.4/fortios-log-message-reference/524940/introduction
4.4 log作成条件
各ポリシー、グローバル設定、debug log、パケットキャプチャなどに於いて、ログの作成・変更が可能です。
debug logは、大量のログを作成します。このためログの保管先にご注意ください。
FortiDocument Library Administration Guide Troubleshooting
https://docs.fortinet.com/document/fortigate/6.4.2/administration-guide/59751/troubleshooting
注釈
Firewall Policy ID:0(Implicit Deny) 暗黙の拒否 のログは、初期状態ではdenyです。
4.5 特定のlogのみの保管
syslogの機能を利用することで特定のlofをフィルター、syslogへ出力することが可能です。
利用は、CLIによりフィルターを作成する必要があります。
FortiDocument Library CLI Reference config log syslogd filter
https://docs.fortinet.com/document/fortigate/7.4.4/cli-reference/273422104/config-log-syslogd-filter
注釈
フィルターは、syslogdを前提としたものです。通常は、ポリシー・各種設定に応じてログが作成、保管されます。
4.6 sample logs
下記は、FortiOSにより作成、保存されるログのサンプルです。
FortiDocument Library CLI Reference config log syslogd filter
注釈
GUI表示は、作成されたログを基に表示される機能です。このためどのようなログが作成されるかは、サンプルログを代用し確認ください。